
The ZigZag indicator with the Elliott Wave theory, focusing specifically on the 5-wave impulse cycle:
Using the ZigZag Indicator to Identify Elliott Wave 1–2–3–4–5 Cycles
Introduction
The Elliott Wave Theory is a powerful concept in technical analysis that suggests markets move in predictable wave patterns, driven by investor psychology. The most well-known part of the theory is the 5-wave impulse cycle, which moves in the direction of the primary trend.
To effectively identify these waves on a chart, traders often use the ZigZag indicator. This tool helps simplify price action, making the waves easier to spot and label.
The Elliott Wave 1–2–3–4–5 Structure
The 5-wave pattern in Elliott Wave theory is structured as follows:
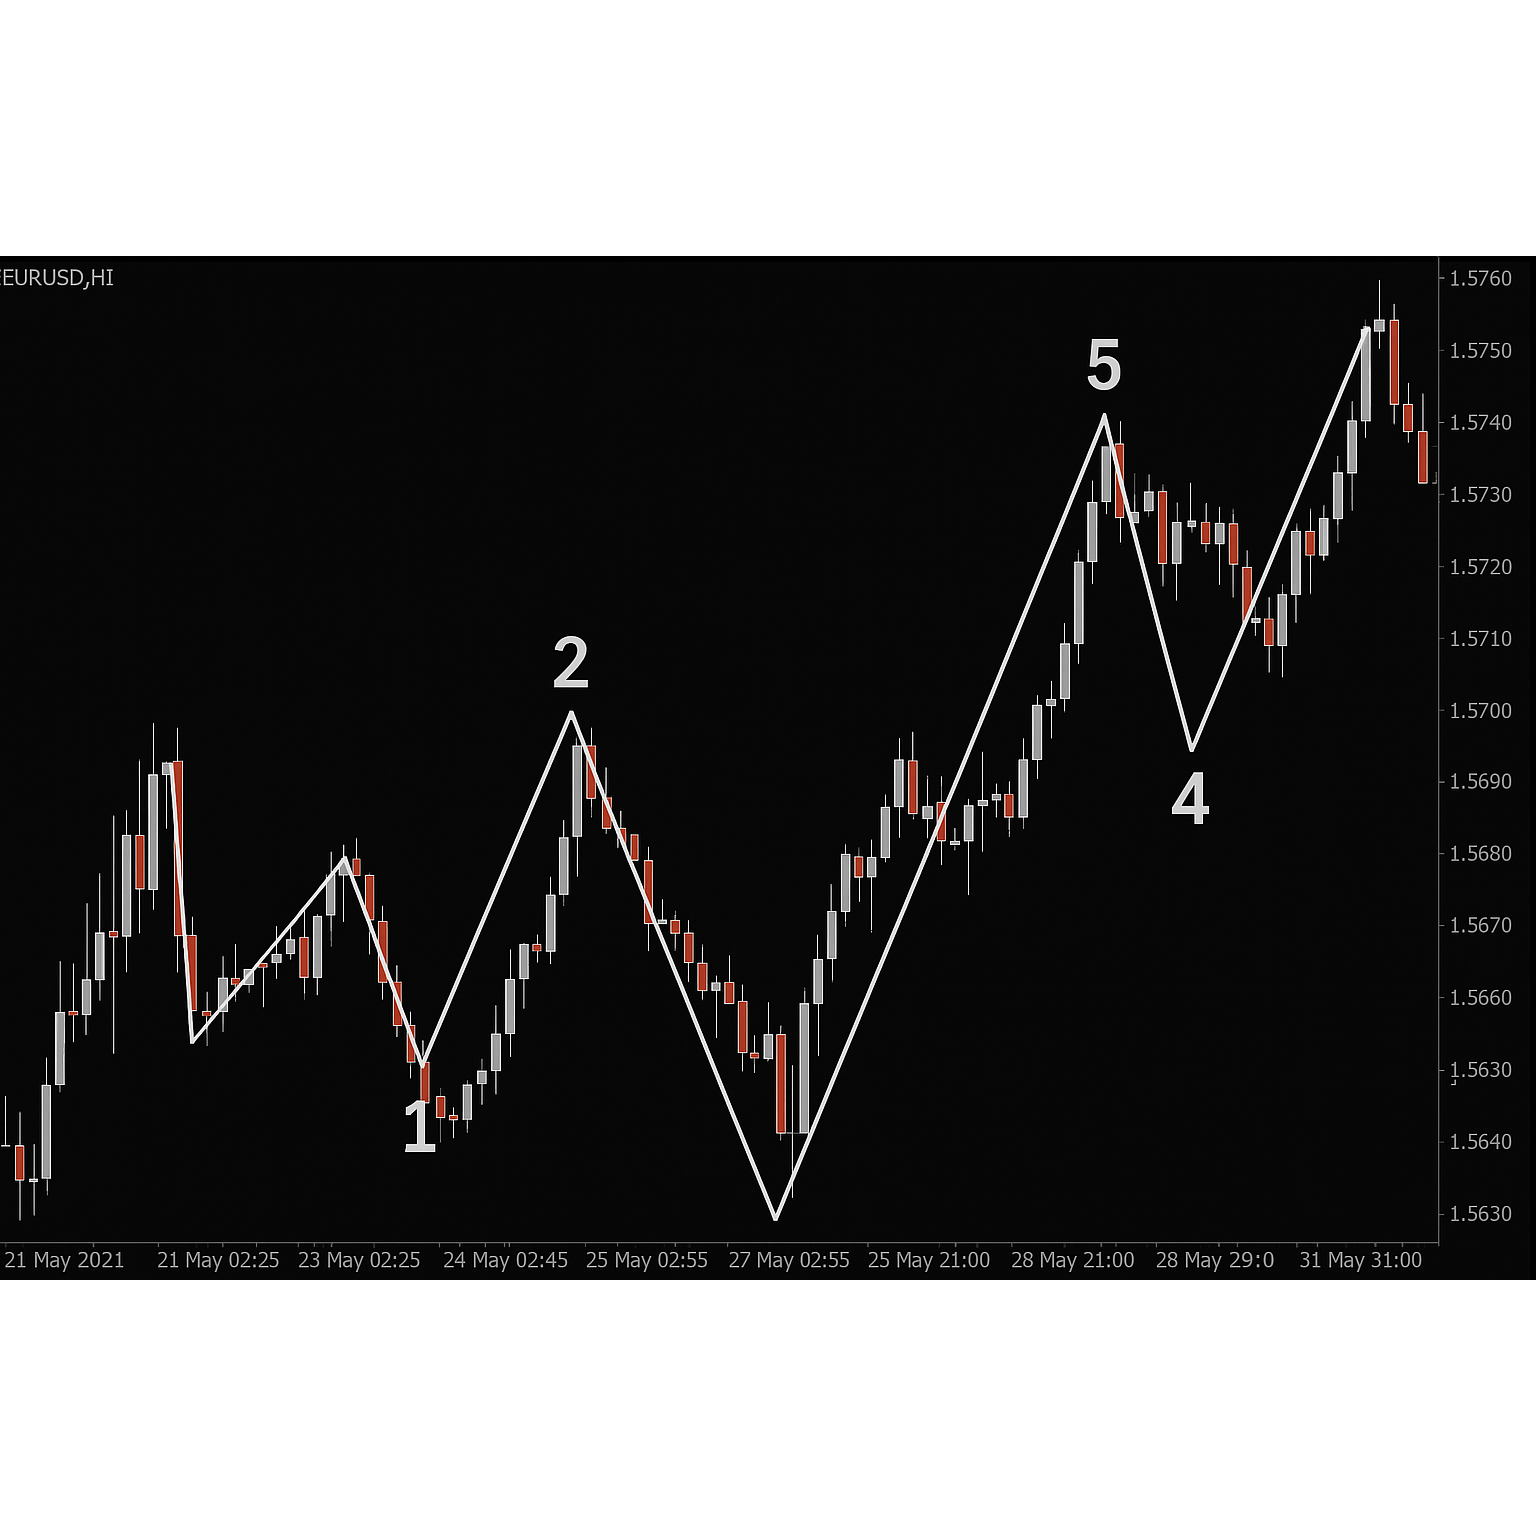
Wave 1: The initial move in the trend direction.
Wave 2: A corrective pullback that retraces part of Wave 1.
Wave 3: Typically the longest and strongest wave — a powerful continuation of the trend.
Wave 4: A smaller correction that usually doesn’t overlap Wave 1.
Wave 5: The final push in the direction of the trend before a larger reversal or correction occurs.
This structure forms the core of many trend-following strategies.
Role of the ZigZag Indicator
The ZigZag indicator filters out minor price movements and focuses on significant highs and lows — exactly what traders need when trying to identify Elliott Waves.
How It Helps:
Clarity: By highlighting major swings, the ZigZag makes wave counts more visible.
Pattern Recognition: It allows easier labeling of Wave 1–2–3–4–5.
Customizable Sensitivity: Traders can adjust the period setting to match their analysis timeframe. A lower period value will show more detail; a higher one will filter noise.
How to Identify Waves Using ZigZag
Here’s a simplified approach using the ZigZag:
Set the ZigZag with an appropriate period (e.g., 12 for medium sensitivity).
Look for the first significant rise — that’s likely Wave 1.
Wait for a corrective pullback (Wave 2).
The next strong move up will often be Wave 3 — typically the longest.
Another pullback indicates Wave 4.
The final upward swing is Wave 5.
In the image you provided, the pattern reflects this exact structure. With ZigZag lines connecting each high and low, it's easier to trace and label the Elliott Waves.
Tips for Better Accuracy
Use Fibonacci tools to validate wave lengths (e.g., Wave 2 often retraces 50%–61.8% of Wave 1, Wave 3 often extends 161.8%).
Combine with momentum indicators (e.g., RSI) to detect divergences during Wave 5.
Validate wave rules (Wave 3 must not be the shortest, Wave 4 cannot overlap Wave 1, etc.).
Conclusion
The combination of the ZigZag indicator and Elliott Wave theory provides traders with a structured way to analyze market trends and predict future movements. By adjusting the period of the ZigZag, traders can reveal the 1–2–3–4–5 wave structure more clearly and align their strategies with the natural rhythm of the market.
This method is especially powerful in trend-trading systems and can be further refined with other technical tools.